Chart historical prices and sales activity
← Previous · Guide home · Topic index · Download PDF · Next →
BSPi's Market Analysis tools turn the auction records in a Saved Item into charts. They are most useful when those records describe genuinely comparable collectibles.
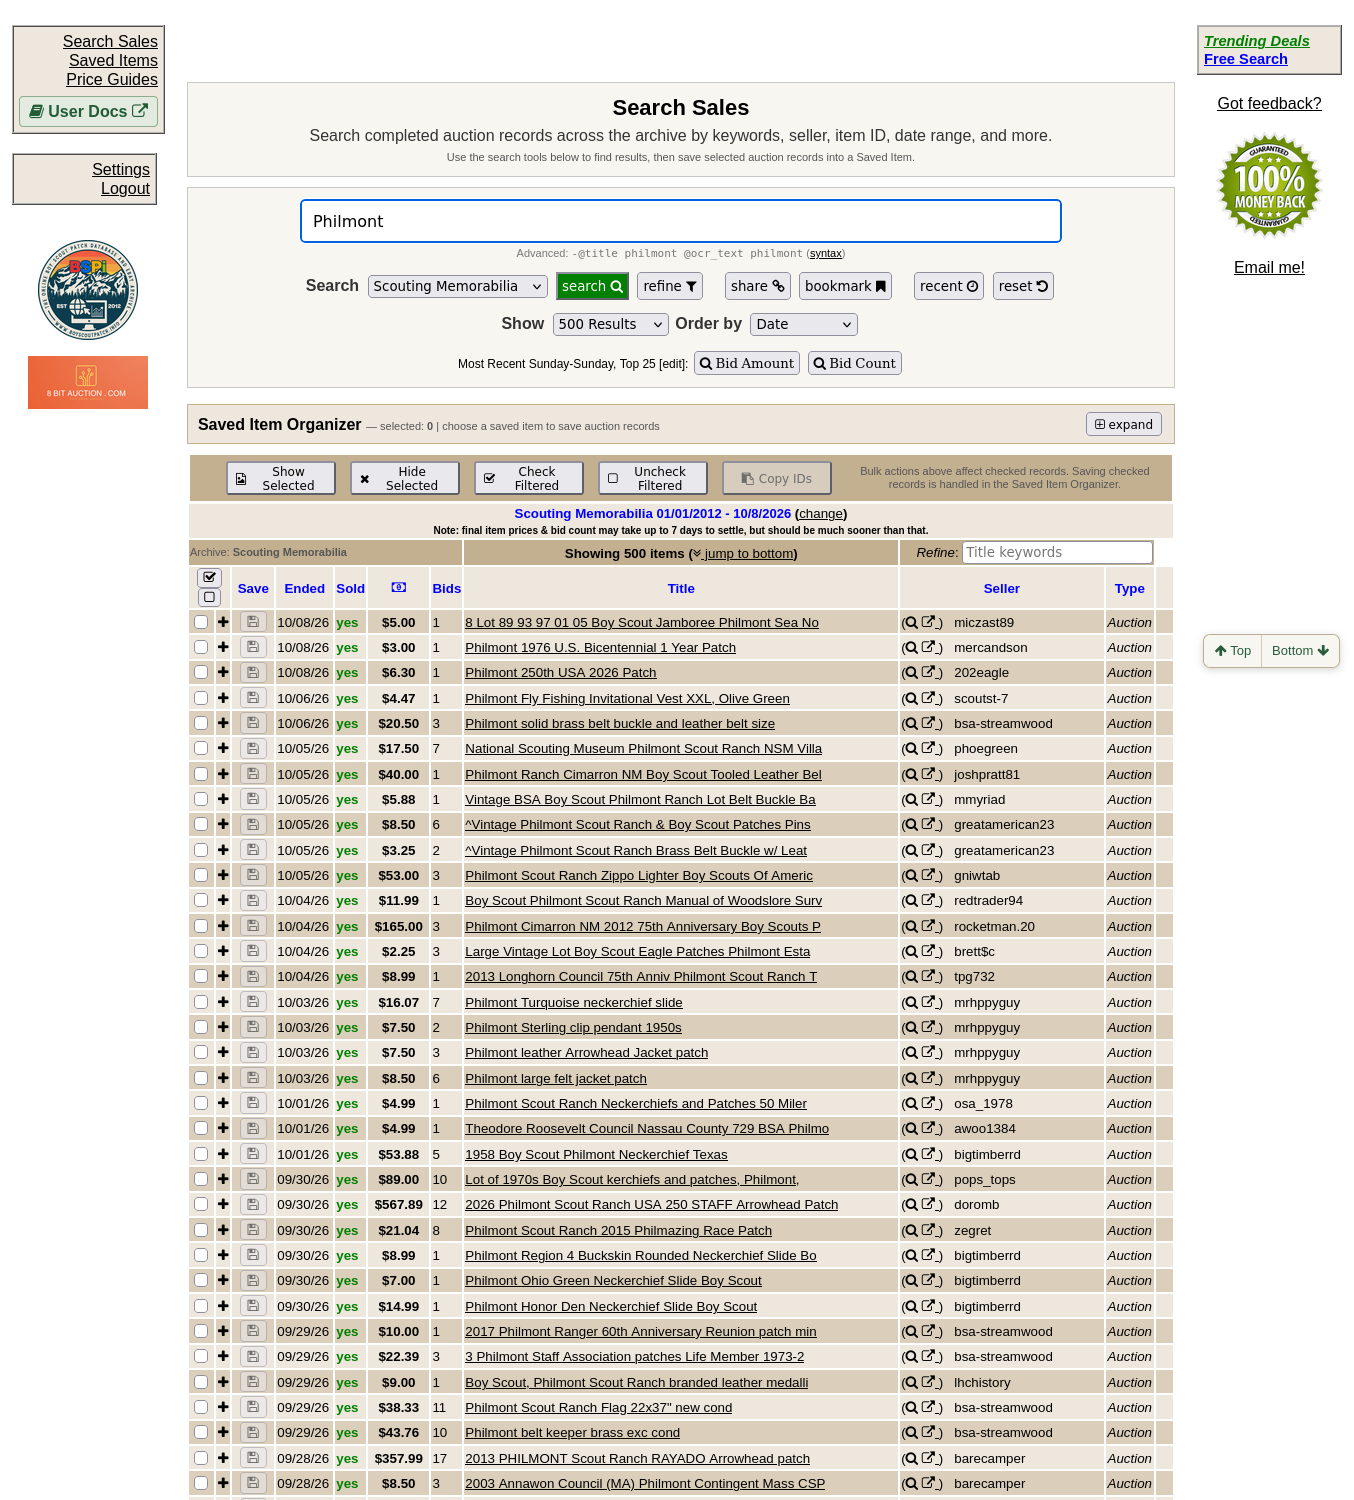
This is the search data from which a Saved Item is assembled. Open charts from that Saved Item's manage sales data view, not directly from Search Sales.
Open Market Analysis
From Saved Items, open manage sales data on an item containing archived records, then choose analyze.
The analysis window offers these controls:
| Control | Choices | Purpose |
|---|---|---|
| Scope | All records; Selected records | Compare the entire item with a checked subset. |
| Chart | Price Trend; Volume by Month; Sold Status; Bid Distribution; Price Distribution | Choose a view suited to your question. |
| Grouping | Raw; Month | Examine individual observations or group by month. |
| Filter | Include all; Sold only | Distinguish reported listing amounts from confirmed sales. |
Choose refresh after changing options, and save image to retain the resulting chart as a picture.
Understand the five charts
Price Trend plots reported prices across time. Volume by Month shows how many archived records appeared in a period; volume does not by itself establish collector demand. Sold Status separates reported outcomes. Bid Distribution shows bidding activity, while Price Distribution shows where displayed prices cluster.
Start with Sold only when studying realized prices. Choose Include all to examine the broader marketplace, keeping in mind that unsold prices are not achieved sales. Some fixed-price listings do not have a meaningful auction bid count.
Compare meaningful subsets
Check records that share an issue, year, condition, or another defensible characteristic, then set Scope to Selected records. Compare with All records. A large difference may reveal that the Saved Item contains unlike material. Open unusual sale records before treating a price spike as a market shift.
Charts support research; they are not an automatic appraisal. Use Sales Data to check the underlying evidence and Price Guides to organize the results.